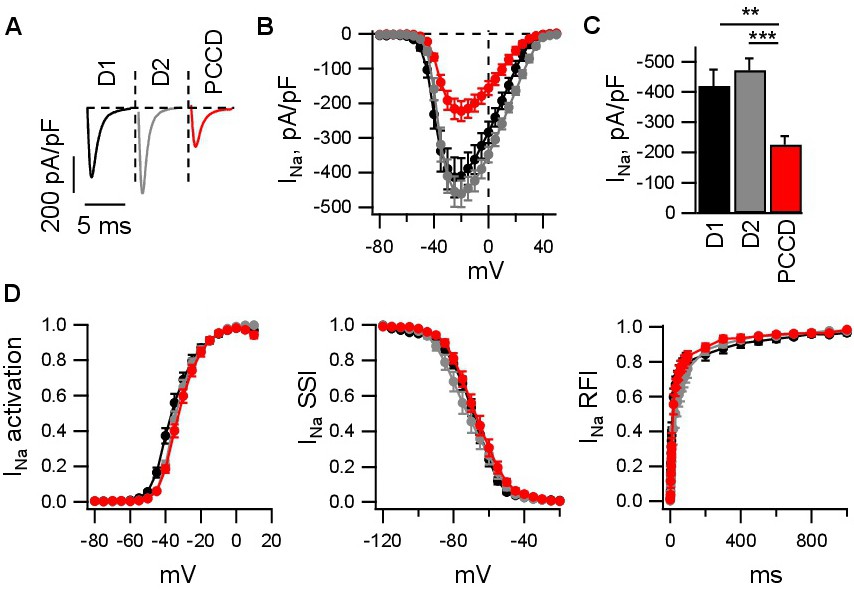
Fig. 2. Effect of DSP-H1684R genetic variant on the amplitude and properties of INa. A. Representative traces of INa in donor iPSC cardiomyocytes (D1, black; D2, grey) and in PCCD cardiomyocytes (red). B. Current-voltage curves depicting the peak amplitude of INa at the indicated voltages. C. Bar plot of maximal INa amplitude obtained during measurements of current-voltage relationship. D. Properties of sodium currents - activation, steady-state inactivation and recovery from inactivation. Detailed values for the parameters of INa properties are shown in Table 1. Asterisk reflects significance (p<0.05), for details see Materials and Methods.